Demographic Infographic Templates: Visualize Data with Impact
Let’s be honest: raw data can be overwhelming. Rows of numbers in a spreadsheet rarely tell a compelling story on their own. For designers, marketers, and content creators, the challenge isn’t just collecting information—it’s transforming that information into something an audience can instantly grasp, remember, and act upon. This is the precise problem that Demographic Infographic Templates solve. They are not just pretty layouts; they are strategic design assets built to communicate complex data with clarity and visual punch.
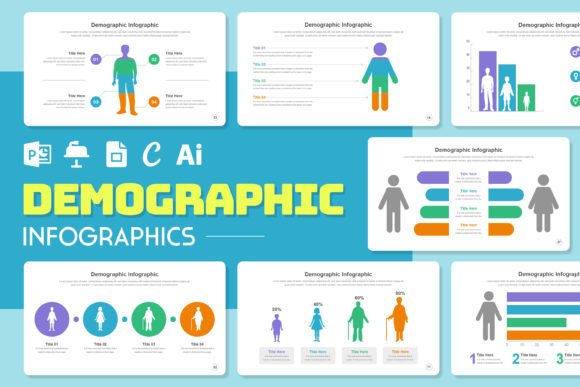
Think of a demographic infographic template as a pre-built narrative framework. It’s a carefully constructed blueprint where every element—chart style, icon placement, color palette, and typographic hierarchy—is designed to guide the viewer’s eye through a story about people. The visual characteristics are intentionally clear and structured. You’ll often find a blend of clean sans serif fonts for readability, bold colors to differentiate categories, and intuitive icons that replace verbose labels. The personality is one of authority and approachability; it feels professional and trustworthy, yet accessible enough for a social media feed or a classroom presentation.
Where These Templates Truly Shine
The versatility of a well-designed demographic infographic template is its greatest strength. In editorial design, they can break up long-form articles in magazines or online publications, providing visual relief while reinforcing key points. For brand identity and logo design projects, presenting market research or audience demographics to a client becomes infinitely more persuasive when wrapped in a cohesive visual. Entrepreneurs and small business owners can leverage them in pitch decks to illustrate target market size, or in packaging design briefs to highlight product appeal across age groups.
They are particularly powerful in digital spaces. As part of a content marketing strategy, a compelling demographic infographic is highly shareable on social media, driving engagement and establishing thought leadership. In web design, they can be integrated into landing pages or about sections to build trust by showcasing company reach or community demographics. For bloggers and publishers, they are a tool to increase time-on-page and make data-driven arguments more digestible. Even in personal projects, like a community report or a hobbyist’s analysis, these templates elevate the presentation from amateur to polished.
The Anatomy of Effective Data Visualization
What makes a template “good”? It starts with a strong visual hierarchy. The most critical data point—the headline statistic—should be the largest or most prominently placed element, often supported by a bold display font. Supporting data flows logically, using a mix of chart types (bar, pie, line) and pictograms to maintain interest without causing confusion. The choice of typeface is critical here; it must be legible at small sizes for labels and data points, yet have enough character in its headers to contribute to the overall aesthetic.
The color scheme should do more than look attractive; it should serve a functional purpose. Using distinct, accessible colors to code different demographics (e.g., age ranges, geographic regions) allows for quick scanning. The overall style should be consistent with the project’s brand guidelines—whether that’s a minimalist, corporate look using a sophisticated serif font pairing, or a vibrant, playful style with a handwritten font accent for a more casual audience. The goal is consistency that reinforces brand perception and professionalism.
A Practical Guide to Selection and Use
Choosing the right template is about more than just liking the preview. First, evaluate the project fit. Does the template’s structure match the story your data tells? If you’re comparing two groups, a template with side-by-side charts is ideal. If showing change over time, look for ones with strong timeline or line graph sections. Always check the readability at various scales; a template that looks stunning on a full-page print might lose critical detail when viewed on a mobile phone.
Next, consider font pairings and customization. A premium template will often come with suggested font stacks. Test how the primary sans serif for body text pairs with a potential script font or modern typography display face for headers. Ensure the template includes all the styles you need—bold, italic, and various weights—to create emphasis and hierarchy without breaking the design’s cohesion. If the project is commercial, always verify the commercial font licensing that comes with the template to avoid legal pitfalls down the line.
Finally, don’t treat the template as a rigid cage. The best use of a demographic infographic template is as a starting point. Adapt the color palette to your brand’s exact hex codes. Swap out placeholder icons for custom ones that better represent your niche. Adjust the data visualization to highlight the most surprising or important insight from your research. When you use these templates not as a crutch but as a foundation, you create professional, engaging, and credible visual content that makes your data not just seen, but understood.